24 x 36 inches
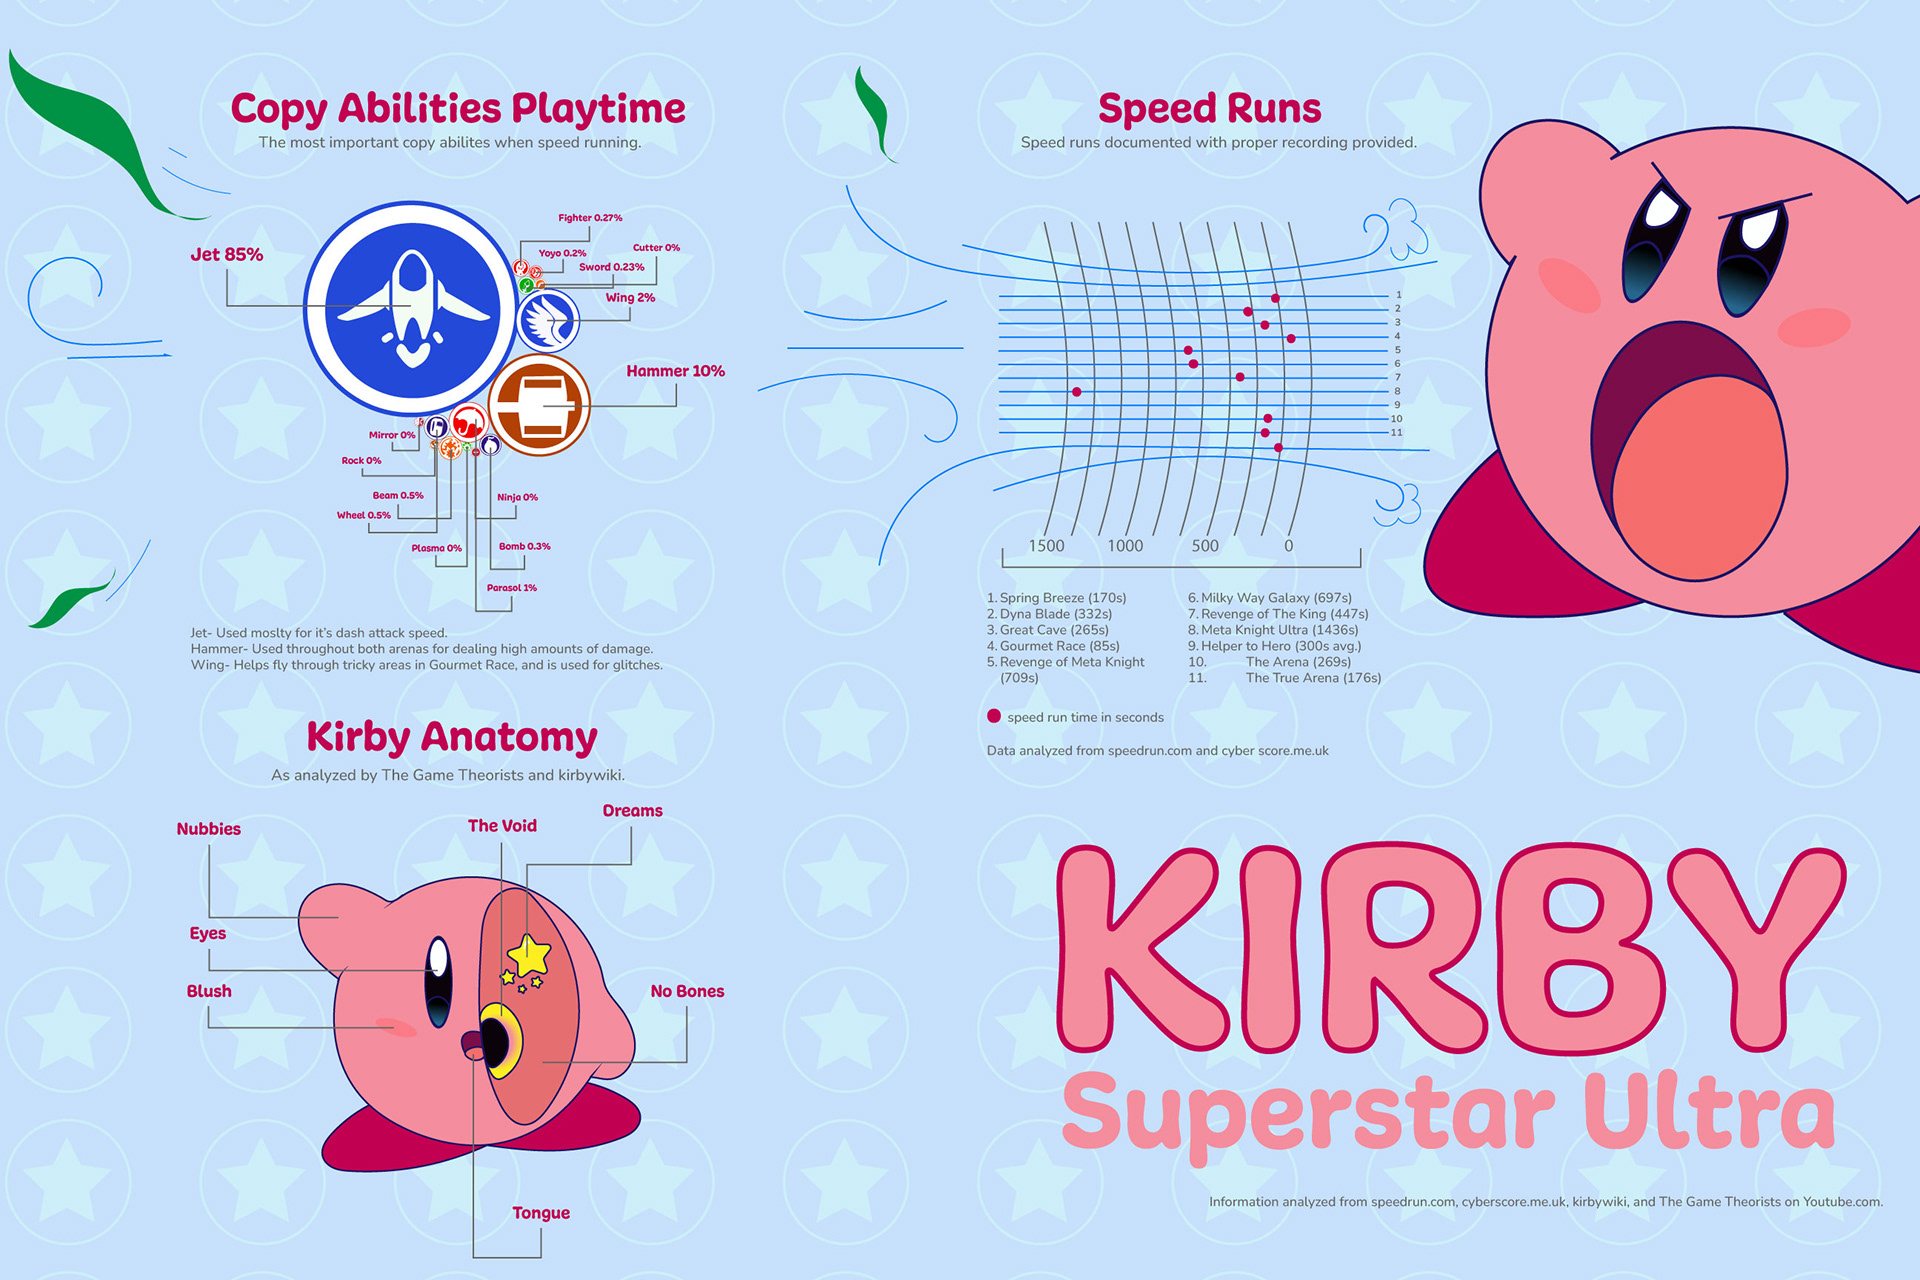
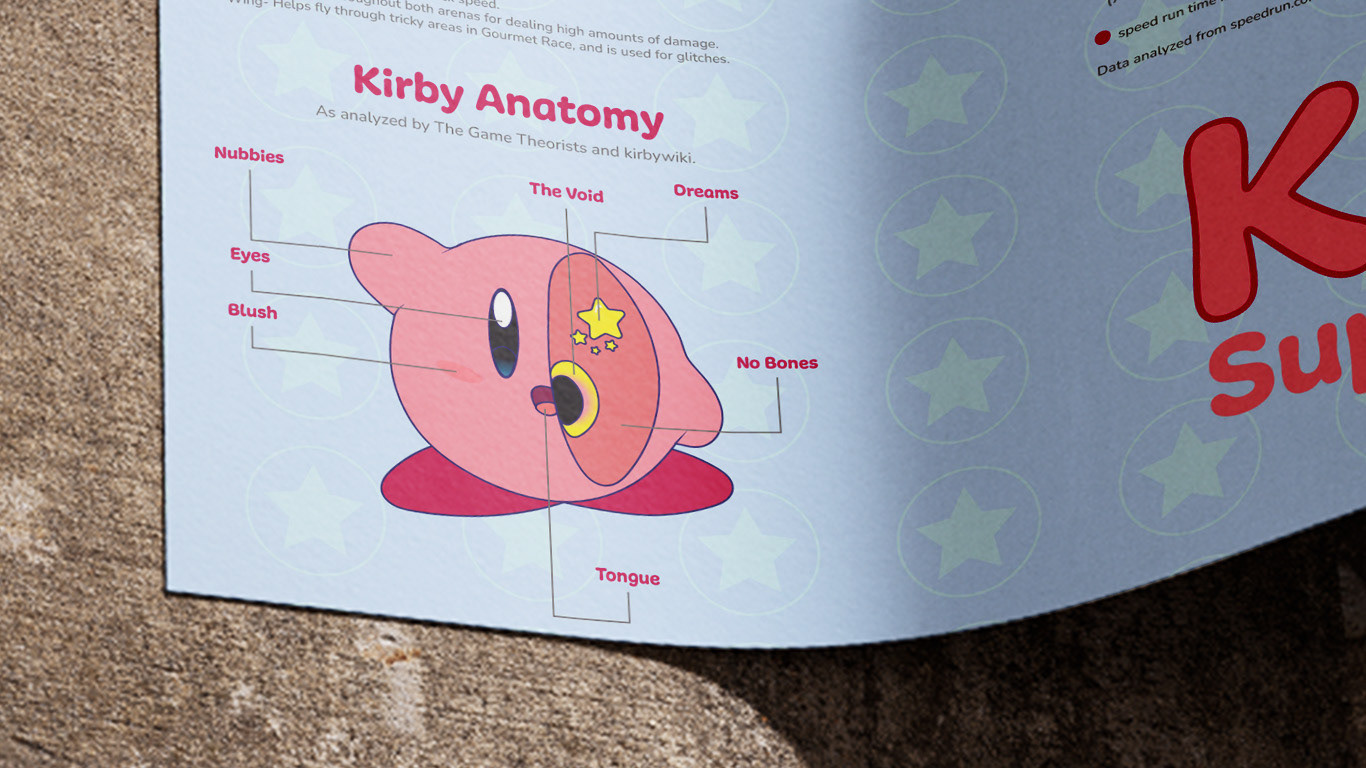
This infographic consists of three main graphics to analyze important information about the iconic 2008 DS game Kirby Superstar Ultra. The first graphic analyzes the top speed run times found on speed run websites and displays them in a dot graph. The dot graph is made to resemble the air that Kirby sucks in during their iconic inhale movement. The next graphic focuses on the abilities that Kirby can switch between throughout the game. In this graphic, a cluster graph is used to show which abilities are used primarily in the duration of the speed runs. The final graphic is an anatomy diagram of Kirby himself based on the creator’s explanation.


